| |
Illustrator
Charts and Graphs |
 |
 |
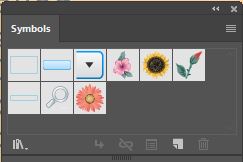
Click and hold to see the Illustrator graph tool options. The palette can be torn off but then you need to know what each symbol represents... Click and drag where you want the graph to appear. Enter the data or import as a .csv or tabbed text. The graph stays live. Apply with the tick and to add colour select with the Direct Selection Tool (A). You can then choose Select>Same>Fill Color to change several bars at one time.
|
||
 |
Before converting the graph to 3D you probably want to delete any stroke colour by setting it to the red bar. Illustrator’s 3D options can be found under the Effect menu > 3D > Extrude and Bevel You need to click the Preview box and you probably want More Options too so that you can change the lighting.. |
||
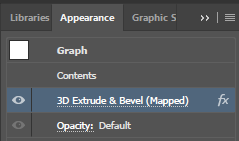 |
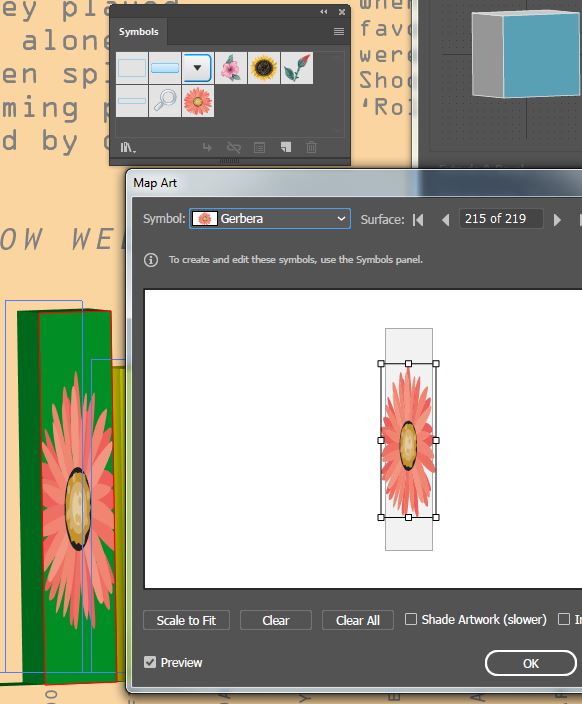
Once you have closed the 3D palette, if you want to change any of the 3D elements you just need to double-click on 3D Extrude and Bevel under the Appearance palette, available from the Window menu. |
||
|
|||